Recently we started investigating the relatively new CEFI data portal which looks to be a promising source of modeled environmental covariates suitable for ecological forecasting. The services and datasets are not fully implemented yet, but we are looking ahead to when we might be able to roll these into our workflows. To that end we have created the cefi R package.
CEFI data is served via a THREDDS and provides dynamic data access using OPeNDAP. We have always leveraged the ncdf4 R package, but this time we decided to try our hand at Michael Sumner’s tidync R package. CEFI data elements are arrayed outputs from model runs (historical and forecast); to cast these as geospatial raster data we access a second “static” data element (also OPeNDAP). We hide all of these details from the user so that obtaining data in a familiar form is quick and easy.
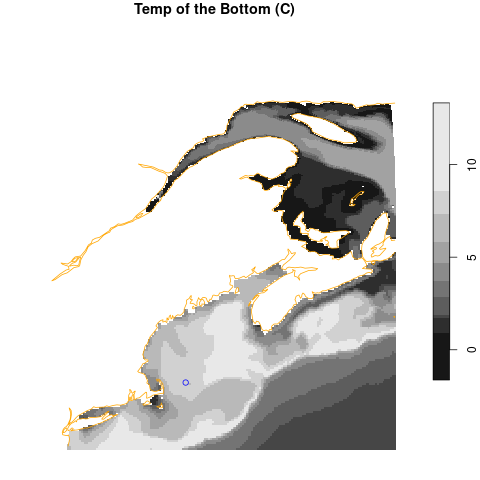
Below we show a single forecasted data product for the temperature of the sea floor in the Northwest Atlantic region in mid-90s. Here we show the temperature of the bottom (C) for one month. We are still learning the finer details of how to work with this data, but it looks promising. We do wish it followed the coastline more closely (the bane of the near-shore scientist!)

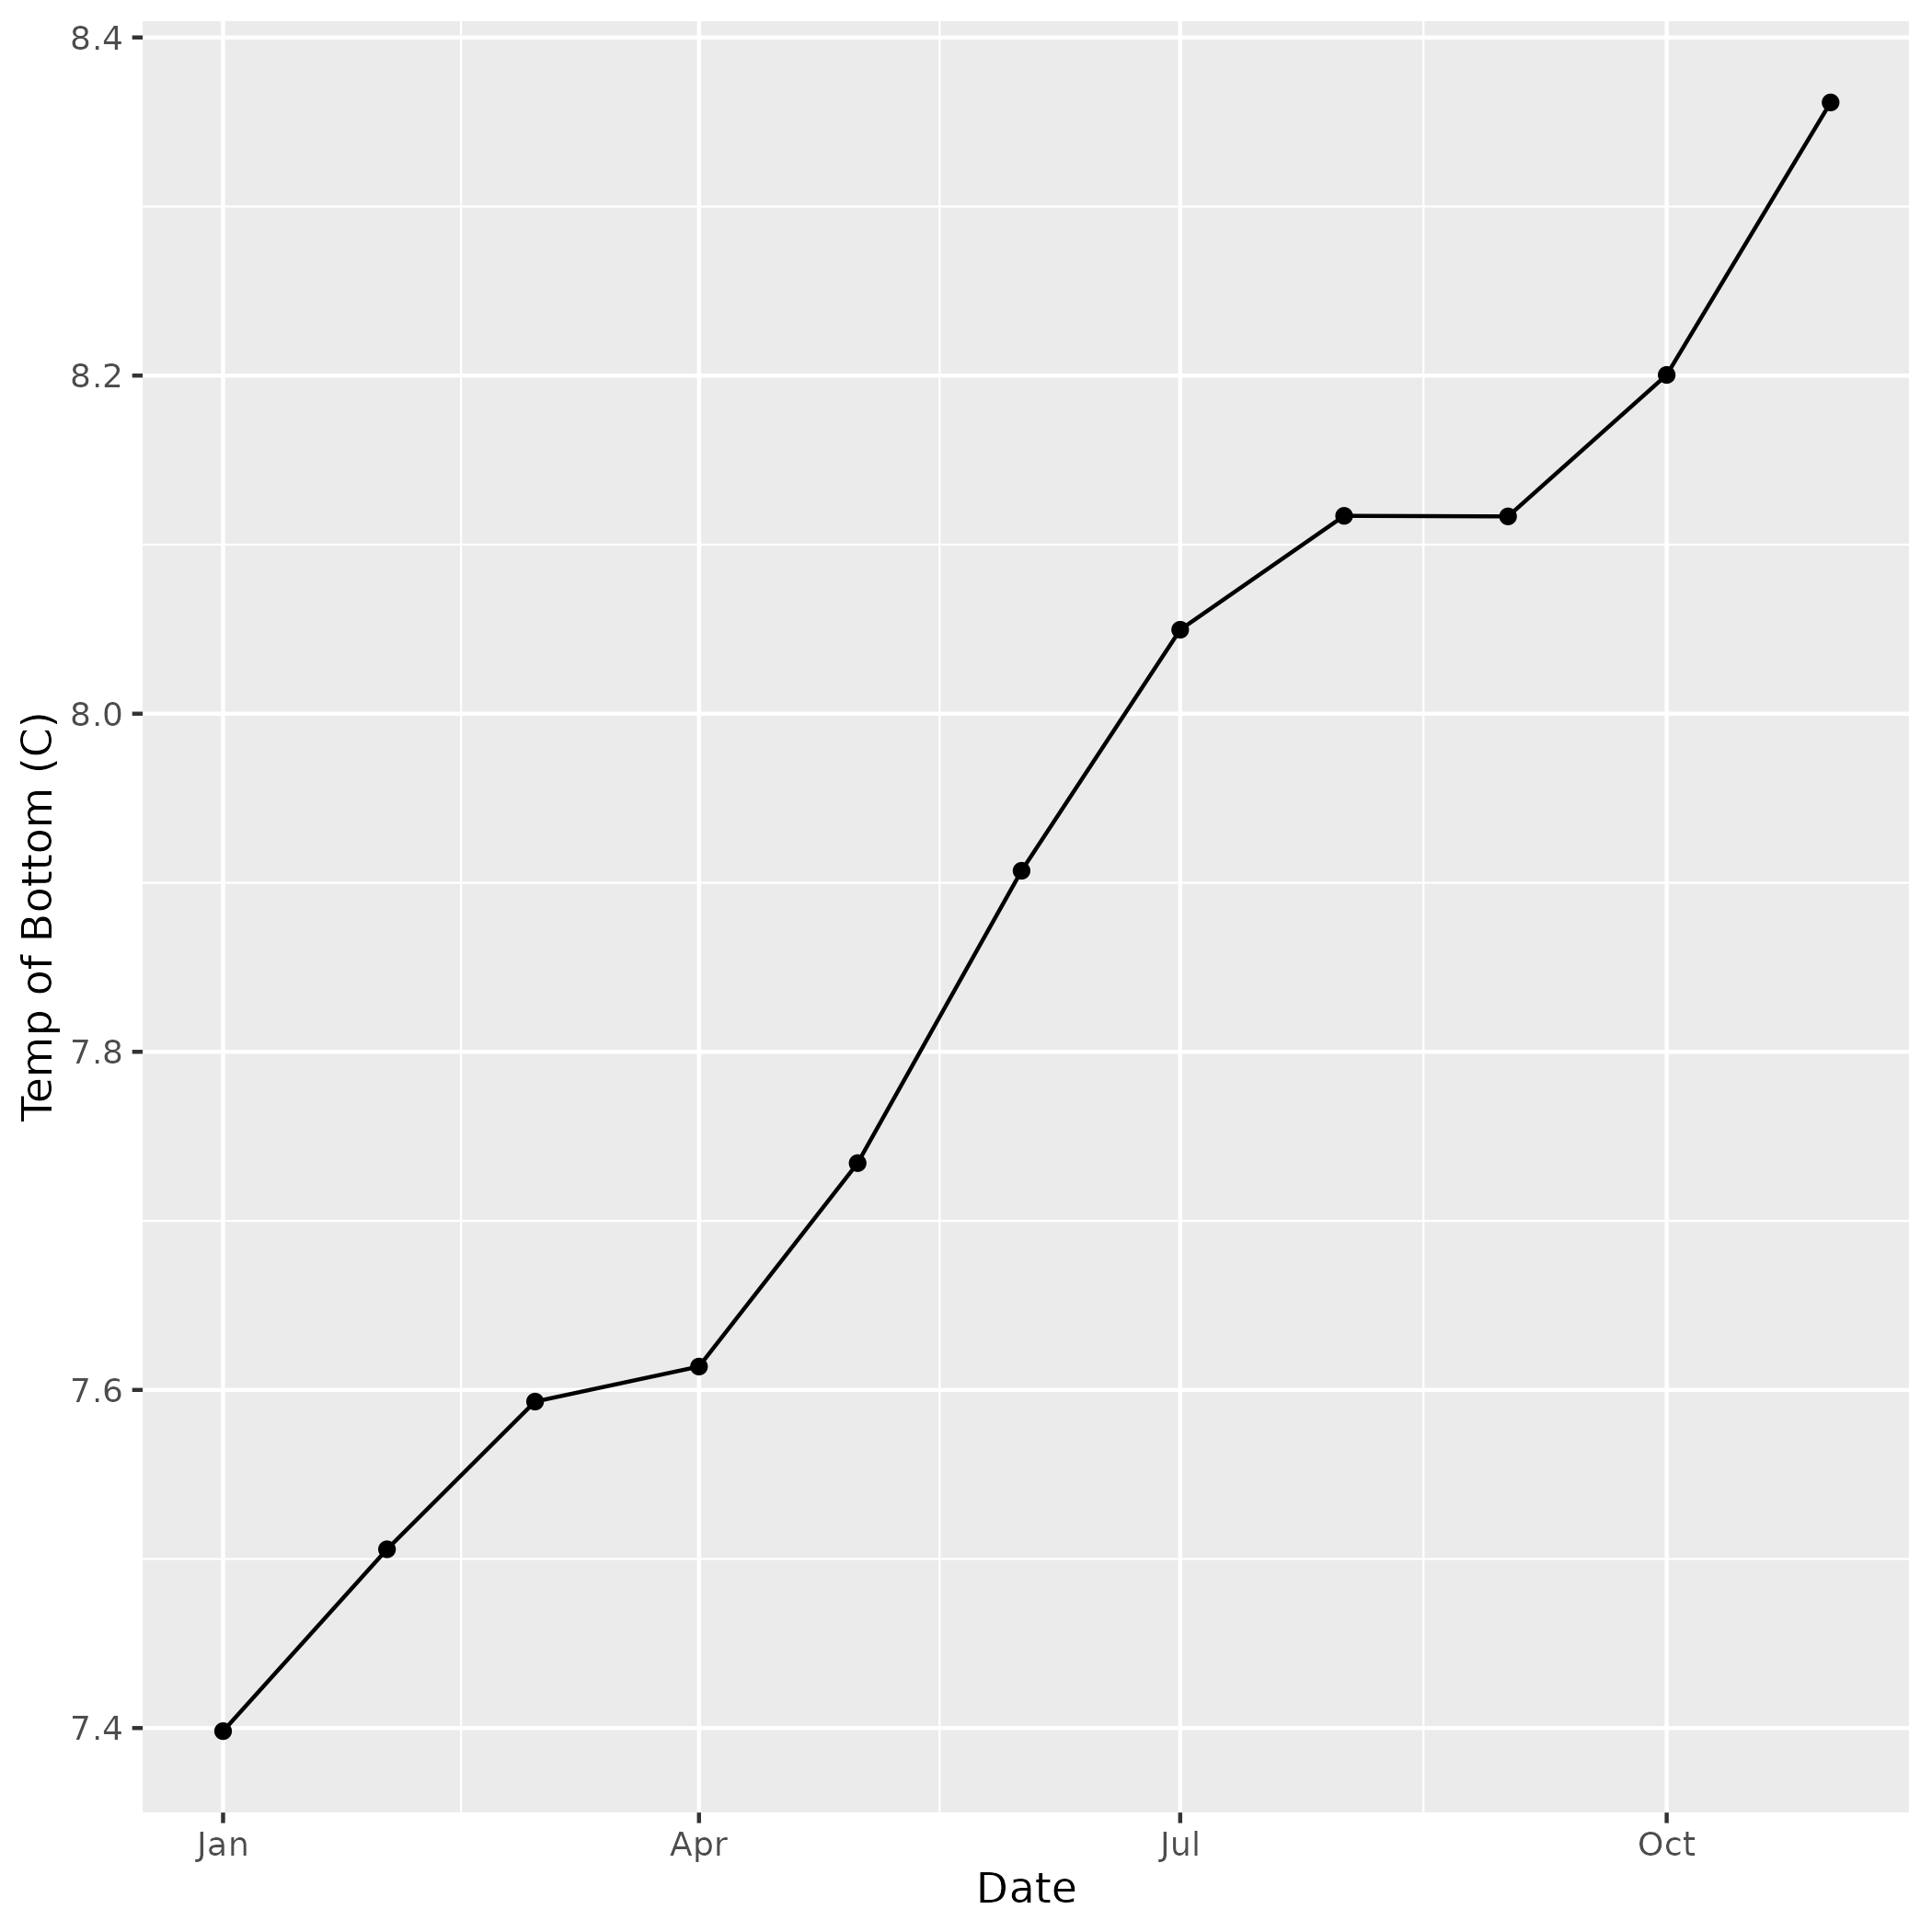
Then we extract the values for the complete forecast (12 months) at the location shown above using the blue circle. Then we plot the forecasted temperatures at that location.
