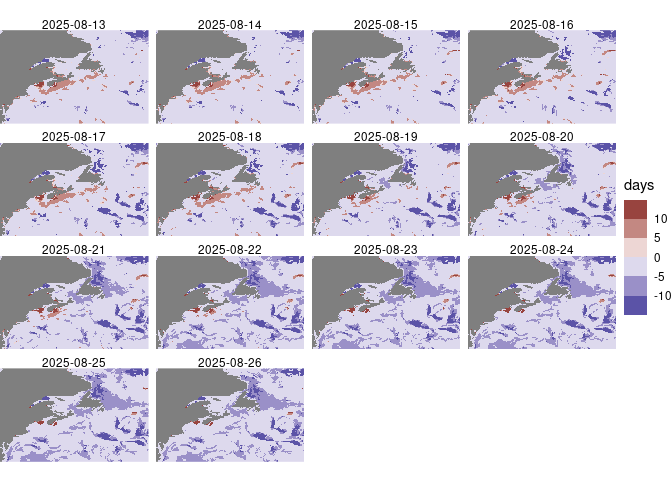
The plot above is generated using the “marine heat wave” methodology proposed by Hobday et al (2016). You can read more about it here. In a nutshell, conditions that identify a heat/cold wave are…
daily values exceed the 90th percentile of values for the day of year measured over the last 30 years, or
daily values fall below the 10th percentile of values for the day of year measured over the last 30 years, and
the event persists for 5 or more days*.
* There is some allowance to merge heat/cold waves that are interrupted by up to 2 days