Moon Jellyfish
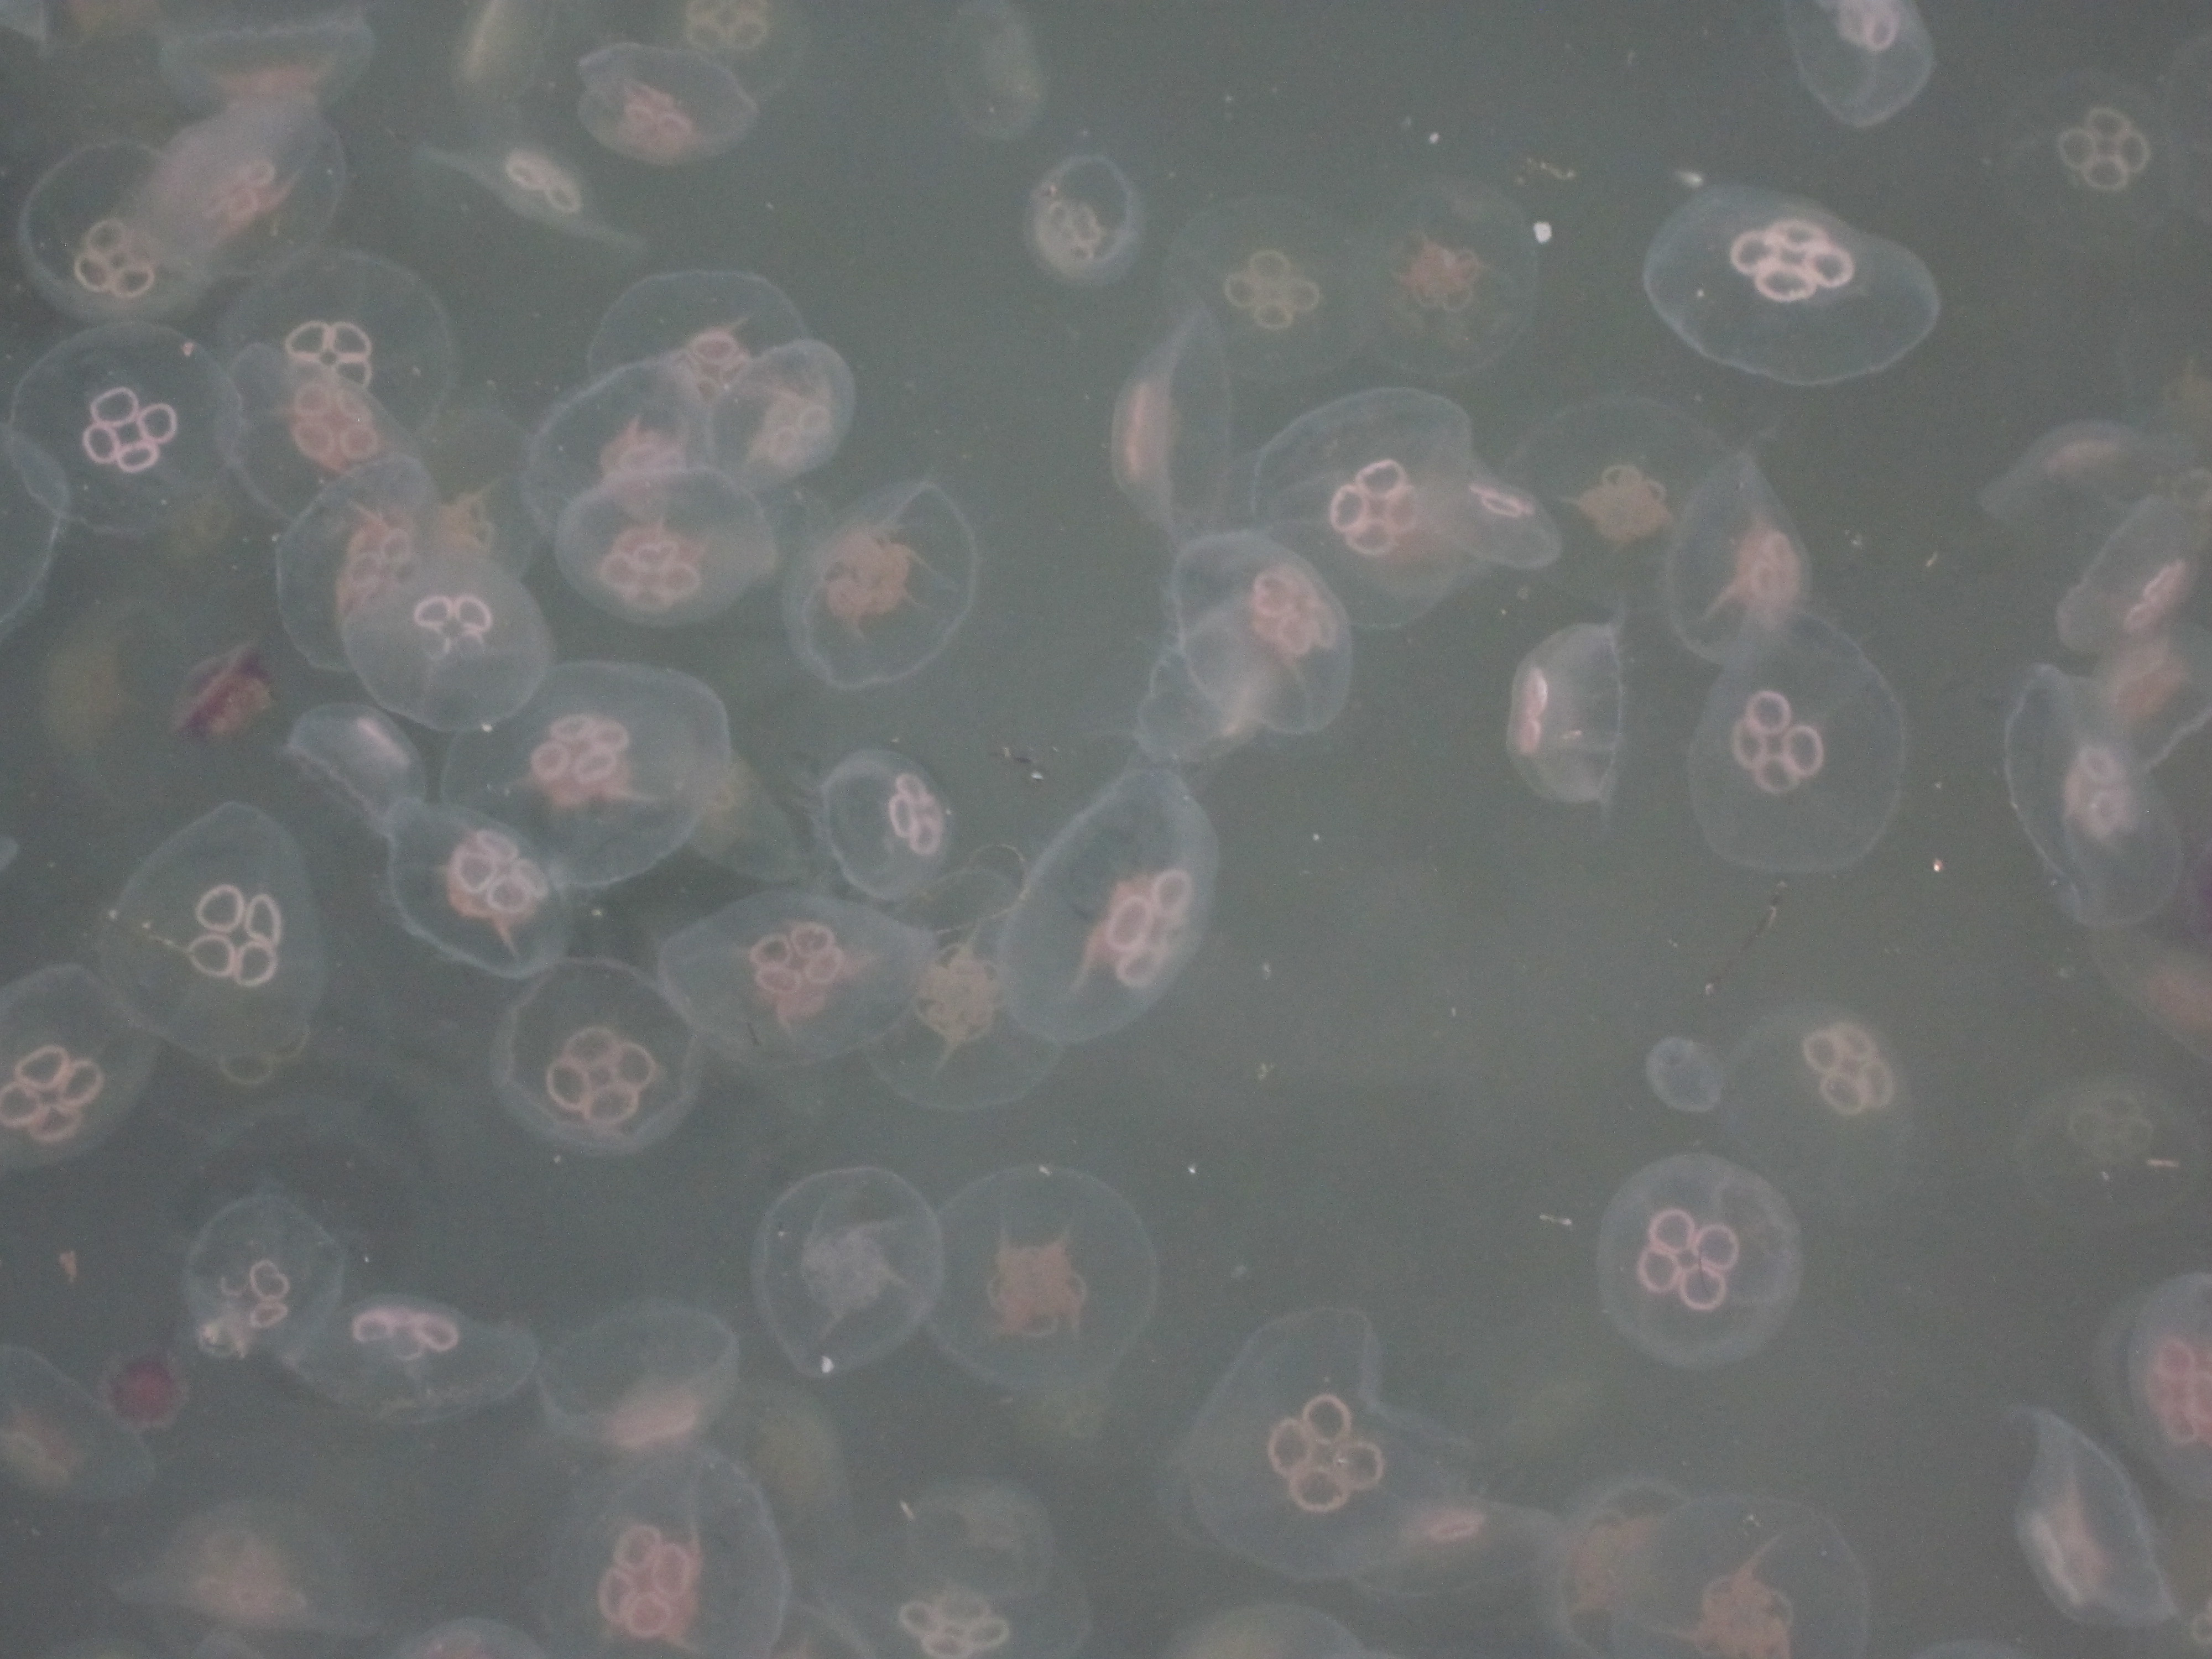
The moon jelly (Aurelia aurita) is one of the most recognizable jellyfish species, known for its translucent, saucer-shaped bell marked by four horseshoe-shaped gonads visible through the top. Moon jellies typically have a bell diameter of 25–40 cm (10–16 inches), with short, fine tentacles around the edge that they use to collect plankton and small organisms from the water. They are found in temperate and tropical coastal waters worldwide, including the Atlantic, Pacific, and Gulf of Maine, often in bays and estuaries where currents concentrate food. Moon jelly stings are generally mild and harmless to humans, often causing little more than minor irritation.
Their diet mainly consists of zooplankton, copepods, mollusk larvae, and small crustaceans, which they trap using their mucus-covered bell and delicate tentacles. Moon jellies are preyed on by sea turtles, sunfish, larger jellyfish, and some seabirds. Like most jellyfish, they have a short lifespan of about a year, cycling through polyp and medusa stages. Despite their delicate appearance, moon jellies are crucial to marine ecosystems, serving as both predators and prey and sometimes providing temporary shelter or a food source for small juvenile fish and crustaceans.
Learn more:
Wikipedia – Moon Jelly
Aquarium of the Pacific
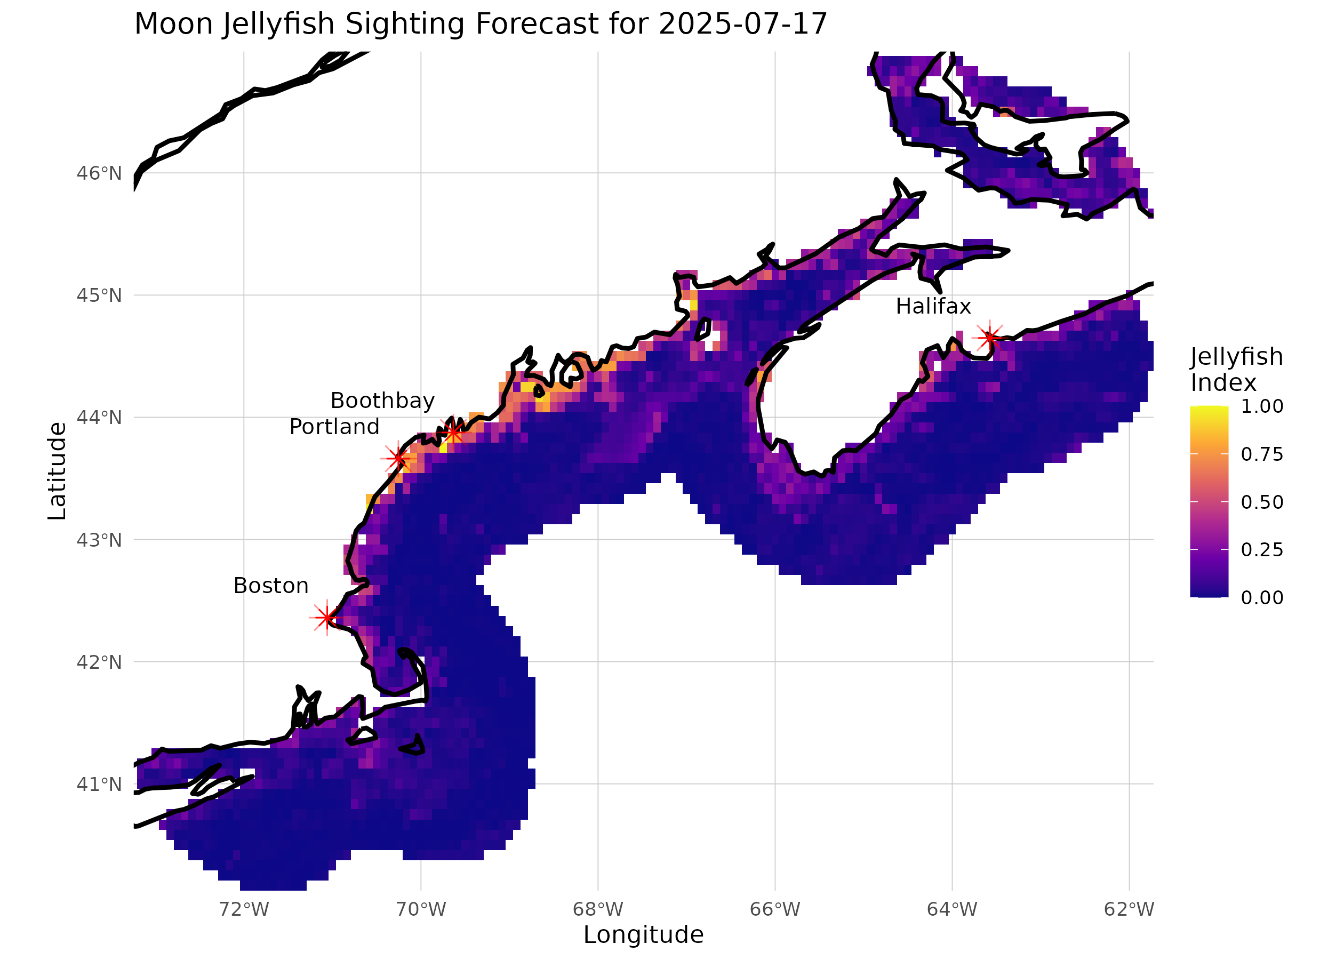
1 Today’s Forecast
2 Forecast Animation
3 Observation Distributions
Code
ggplot() +
  geom_sf(data = coast, color = "black") +
  geom_sf(data = obs, color = "red", size = 1.5) +
  coord_sf(
    xlim = c(coast_bbox["xmin"], coast_bbox["xmax"]),
    ylim = c(coast_bbox["ymin"], coast_bbox["ymax"]),
    expand = FALSE
  ) +
  labs(title = "Moon Jelly Observations",
       x = "Longitude",
       y = "Latitude") +
theme_minimal() 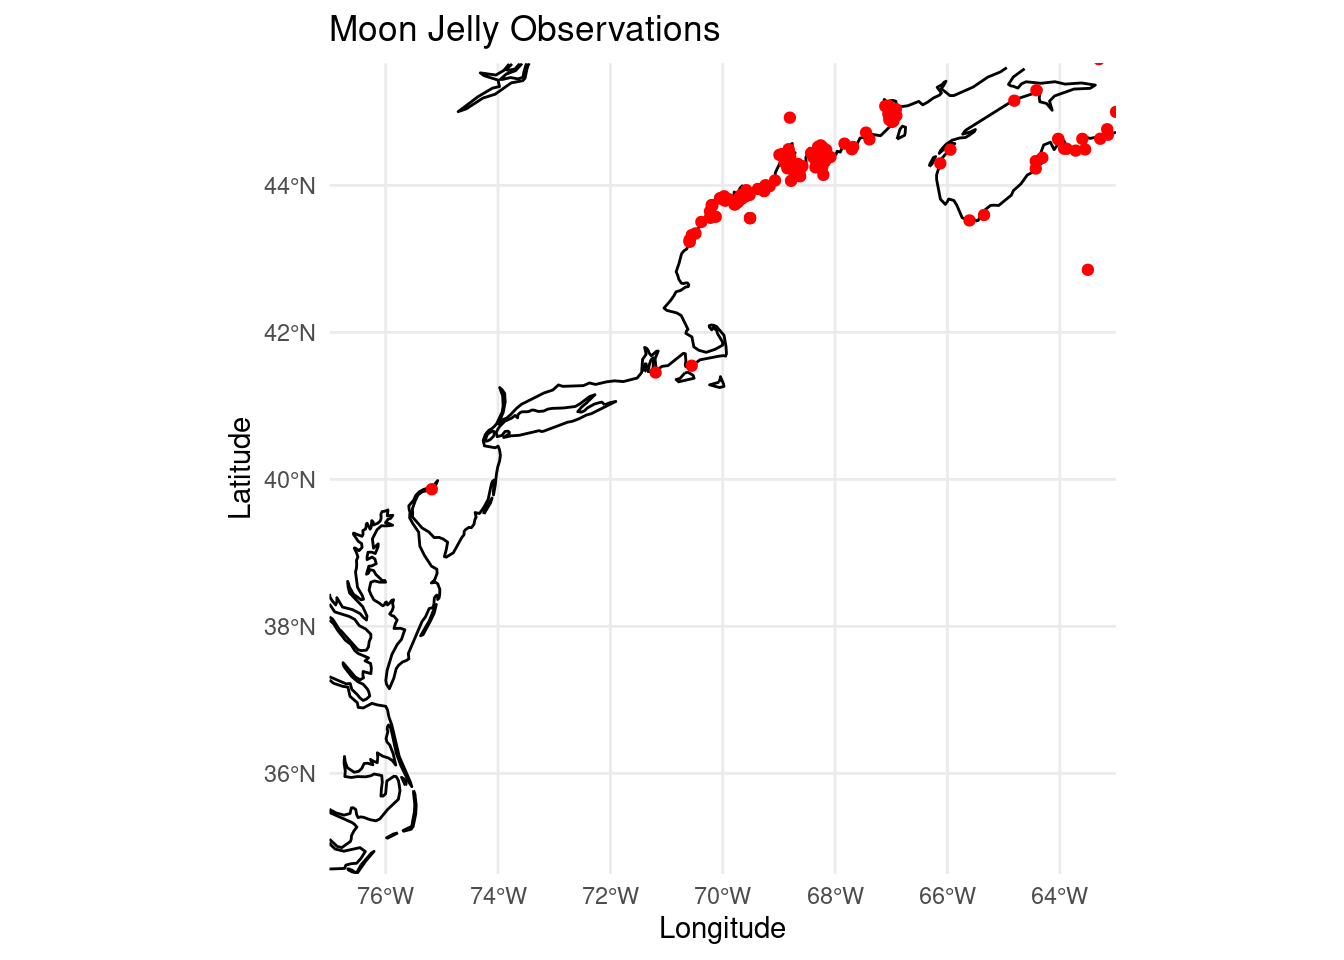
Code
ggplot() +
  geom_sf(data = coast, color = "black") +
  geom_sf(data = obs, color = "red", size = 1.5, alpha = 0.7) +
  coord_sf(
    xlim = c(coast_bbox["xmin"], coast_bbox["xmax"]),
    ylim = c(coast_bbox["ymin"], coast_bbox["ymax"]),
    expand = FALSE
  ) +
  facet_wrap(~ year) +
  labs(title = "Moon Jelly Observations by Year",
       x = "Longitude",
       y = "Latitude") +
  theme_minimal()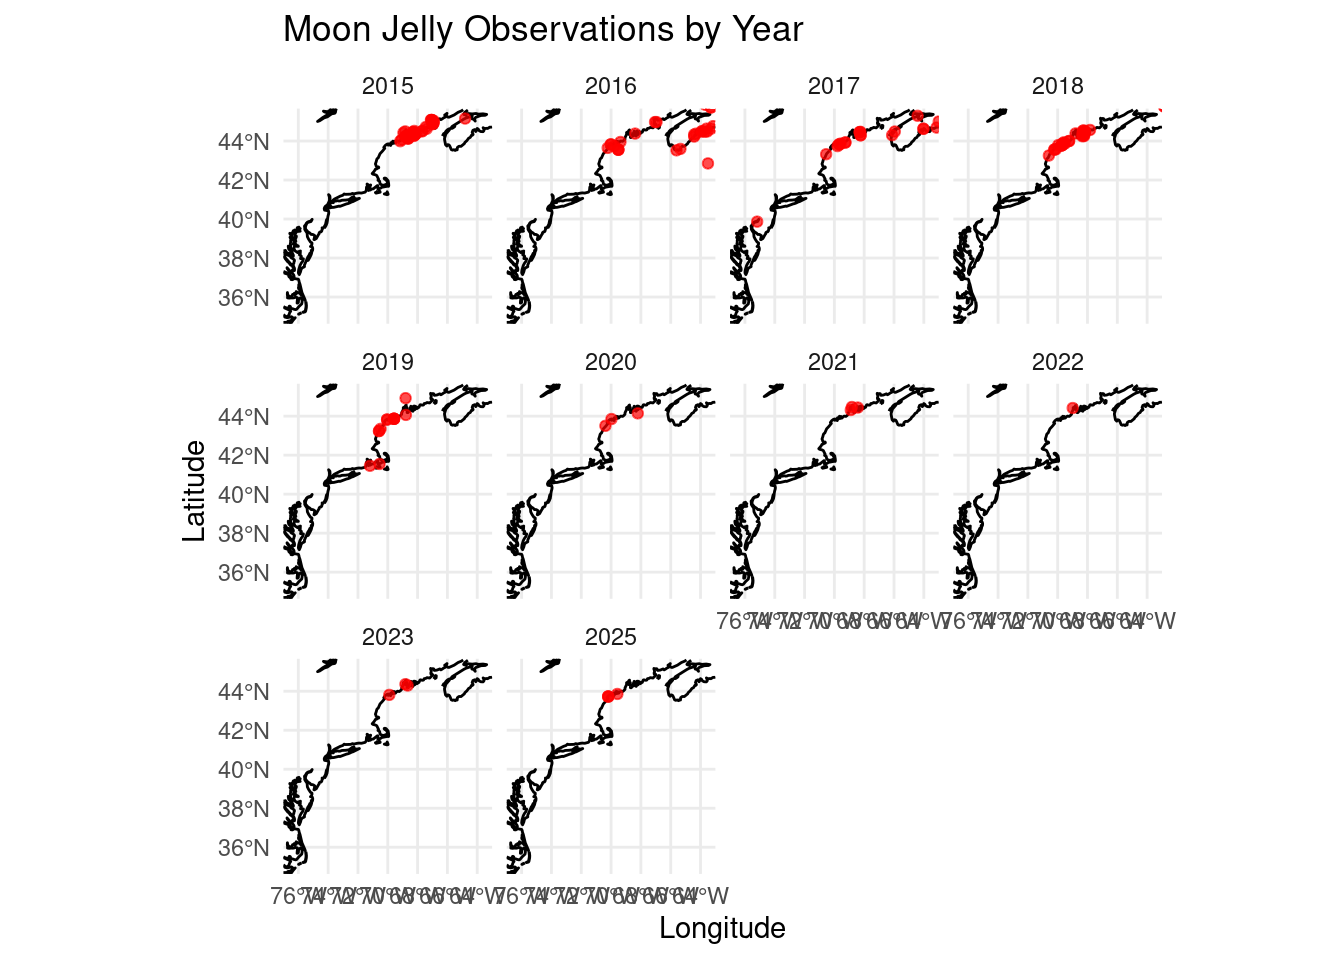
Code
ggplot() +
  geom_sf(data = coast, color = "black") +
  geom_sf(data = obs, color = "red", size = 1.5, alpha = 0.7) +
  coord_sf(
    xlim = c(coast_bbox["xmin"], coast_bbox["xmax"]),
    ylim = c(coast_bbox["ymin"], coast_bbox["ymax"]),
    expand = FALSE
  ) +
  facet_wrap(~ month) +
  labs(title = "Moon Jelly Observations by Month",
       x = "Longitude",
       y = "Latitude") +
theme_minimal() 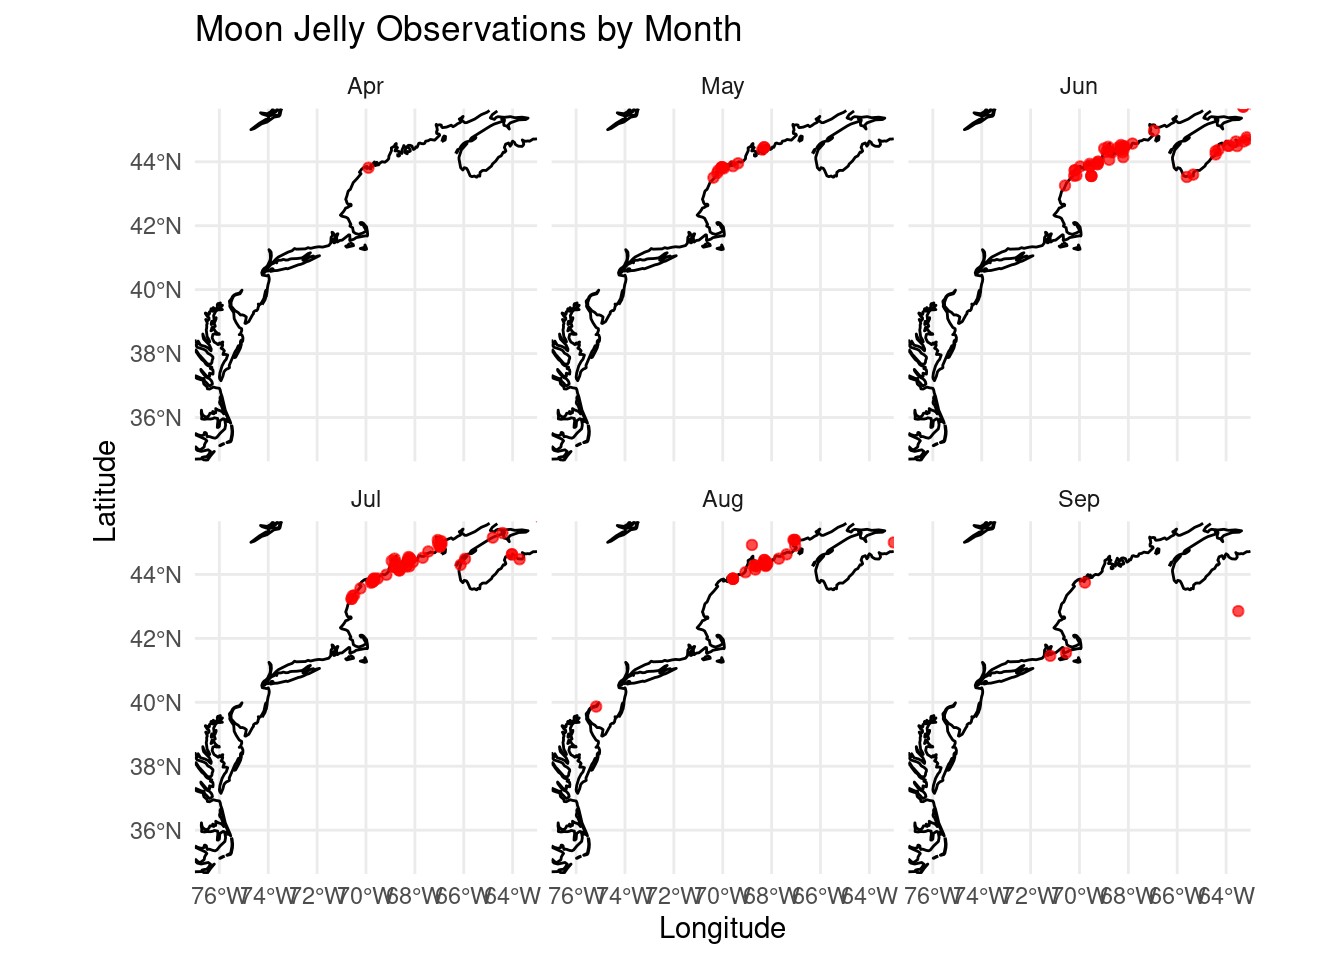
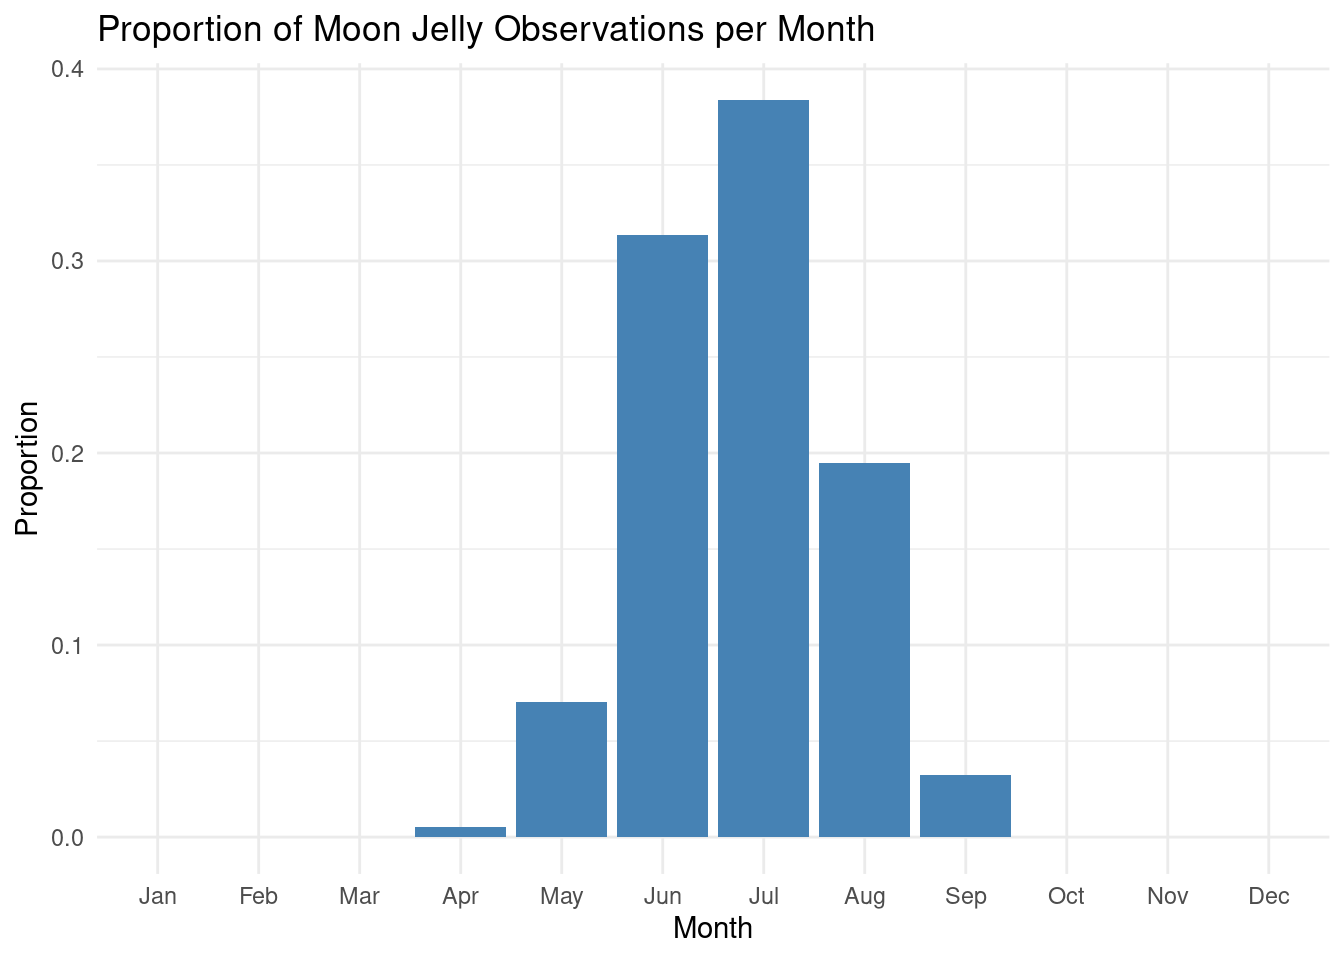
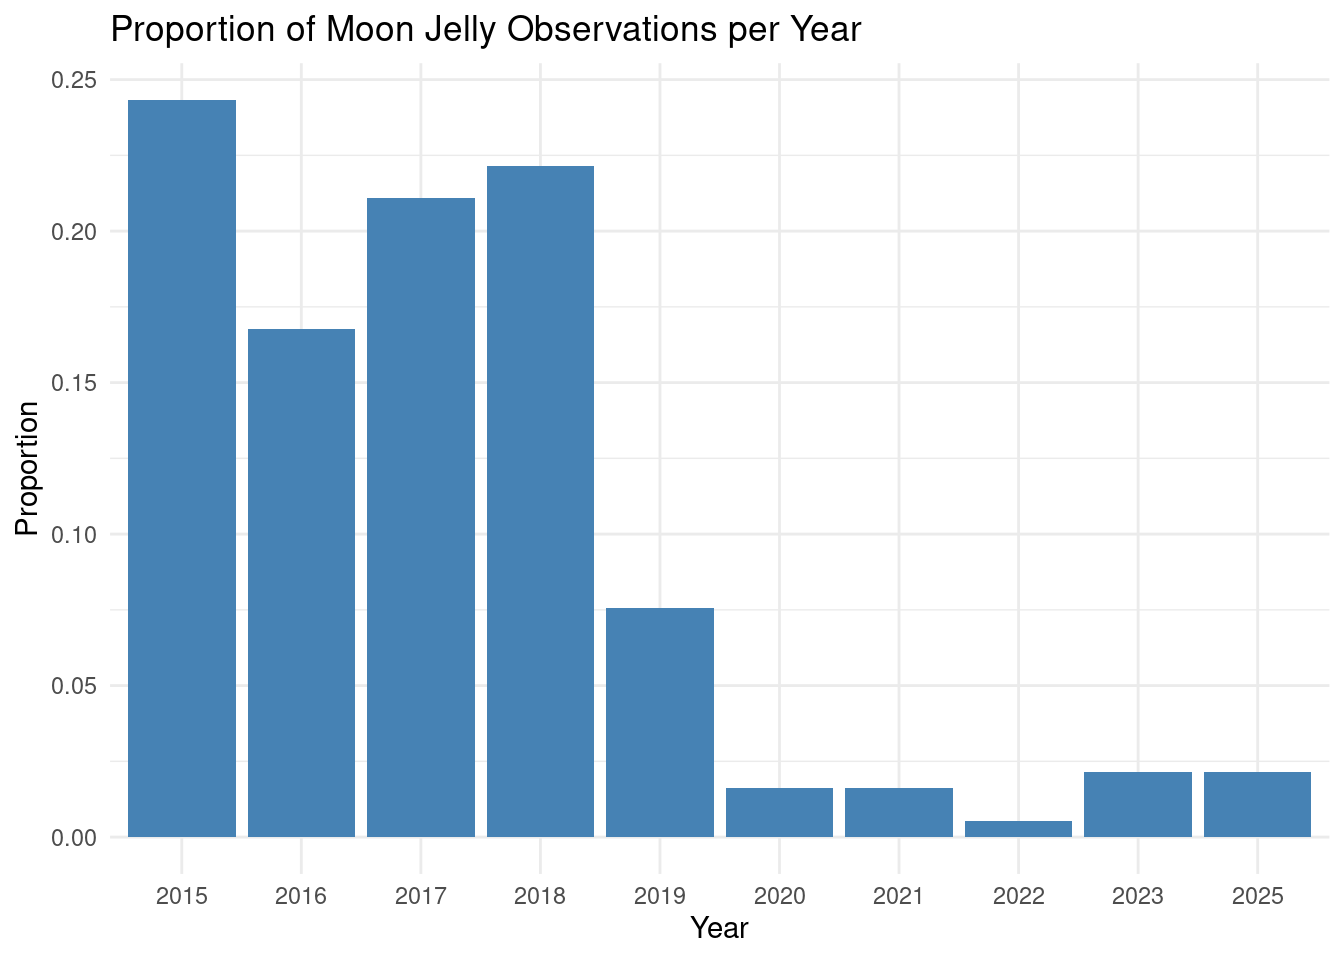
4 Proportion of Observations Histograms
Code
ggplot(obs, aes(x = year)) +
  geom_bar(aes(y = after_stat(prop), group = 1), fill = "steelblue") +
  theme_minimal() +
  labs(
    title = "Proportion of Moon Jelly Observations per Year",
    x = "Year",
    y = "Proportion"
  )
Code
ggplot(obs, aes(x = month)) +
  geom_bar(aes(y = after_stat(prop), group = 1), fill = "steelblue") +
  scale_x_discrete(drop = FALSE) +
  theme_minimal() +
  labs(
    title = "Proportion of Moon Jelly Observations per Month",
    x = "Month",
    y = "Proportion"
  )