Comb Jellyfish
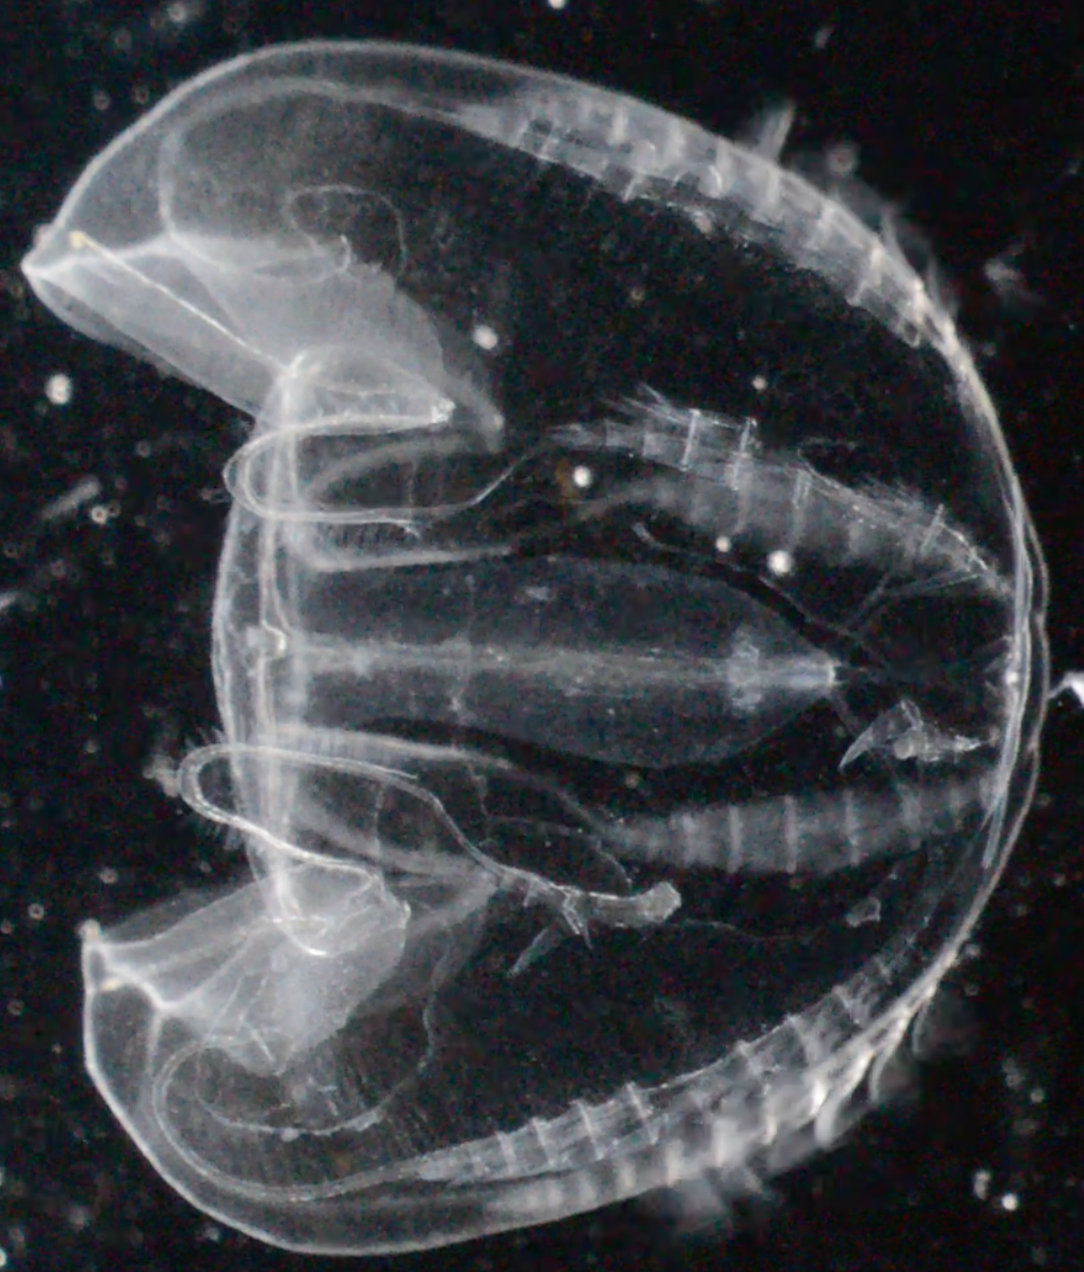
Comb jellies, belonging to the phylum Ctenophora, are not true jellyfish but are often mistaken for them due to their gelatinous bodies. Unlike jellyfish, they lack stinging cells (nematocysts) and instead capture prey using sticky cells called colloblasts. Most comb jellies are small, ranging from a few millimeters to 15 cm (6 inches), and have eight rows of ciliary plates (“combs”) that beat in coordinated waves, refracting light into brilliant, shimmering colors — a hallmark of comb jellies. They are found worldwide in both surface waters and deep seas, including coastal ecosystems like the Gulf of Maine.
Comb jellies feed on zooplankton, larval fish, and even other comb jellies, using their sticky tentacles or lobes to ensnare prey. In some ecosystems, they are preyed on by sea turtles, larger fish, and other ctenophores. Many comb jellies have short life spans, often just a few months, but they play significant roles in marine food webs, sometimes outcompeting fish larvae for plankton and reshaping community dynamics. Unlike true jellyfish, comb jellies do not sting, making them harmless to humans.
Learn more:
Wikipedia – Comb Jelly
Wikimedia Commons Photo
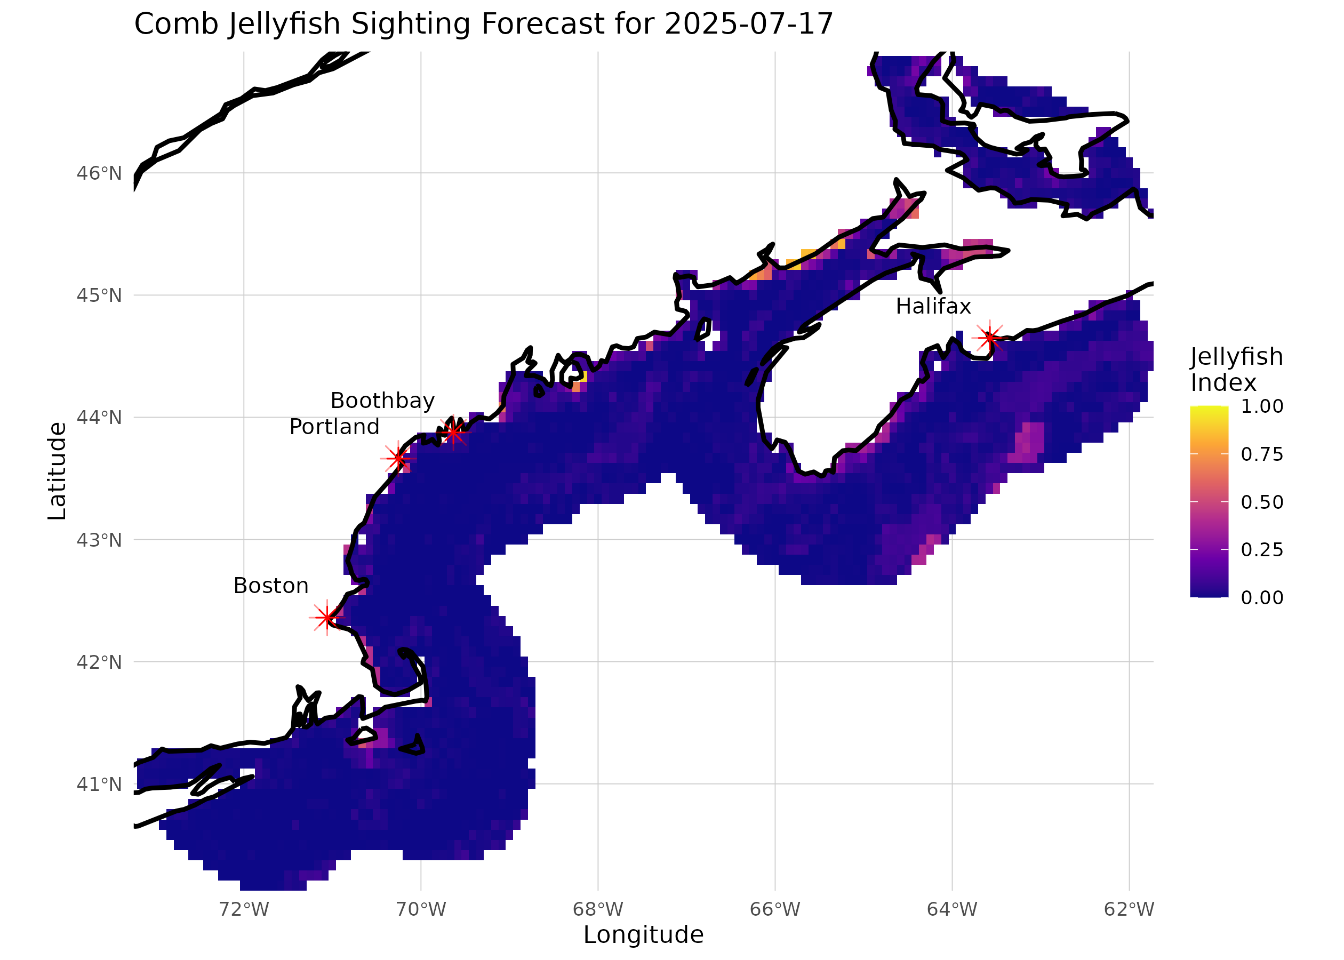
1 Today’s Forecast
2 Forecast Animation
3 Observation Distributions
Code
ggplot() +
  geom_sf(data = coast, color = "black") +
  geom_sf(data = obs, color = "red", size = 1.5) +
  coord_sf(
    xlim = c(coast_bbox["xmin"], coast_bbox["xmax"]),
    ylim = c(coast_bbox["ymin"], coast_bbox["ymax"]),
    expand = FALSE
  ) +
  labs(title = "Comb Jelly Observations",
       x = "Longitude",
       y = "Latitude") +
theme_minimal() 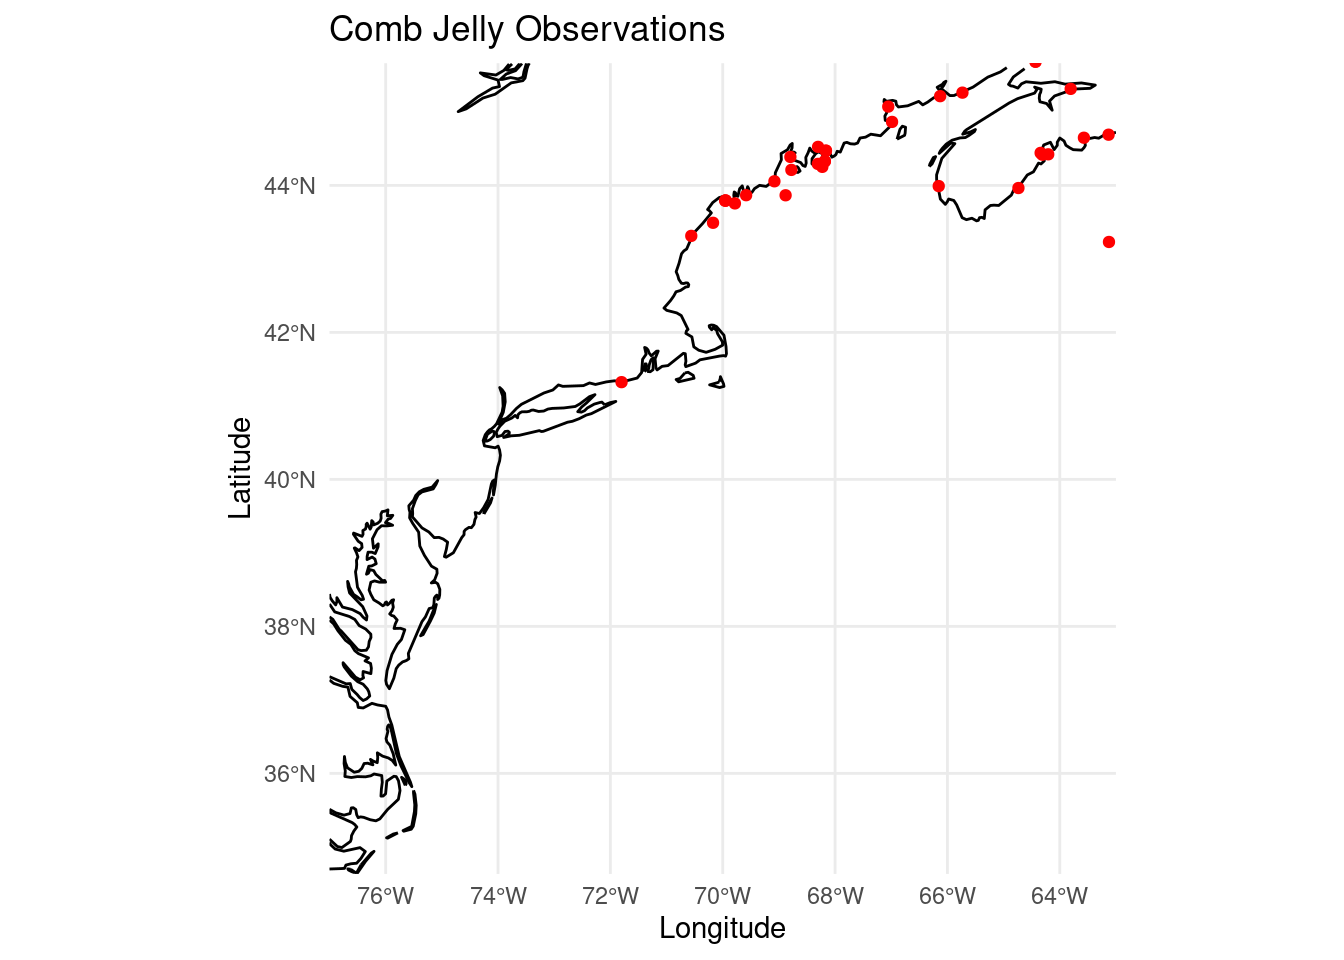
Code
ggplot() +
  geom_sf(data = coast, color = "black") +
  geom_sf(data = obs, color = "red", size = 1.5, alpha = 0.7) +
  coord_sf(
    xlim = c(coast_bbox["xmin"], coast_bbox["xmax"]),
    ylim = c(coast_bbox["ymin"], coast_bbox["ymax"]),
    expand = FALSE
  ) +
  facet_wrap(~ year) +
  labs(title = "Comb Jelly Observations by Year",
       x = "Longitude",
       y = "Latitude") +
theme_minimal() 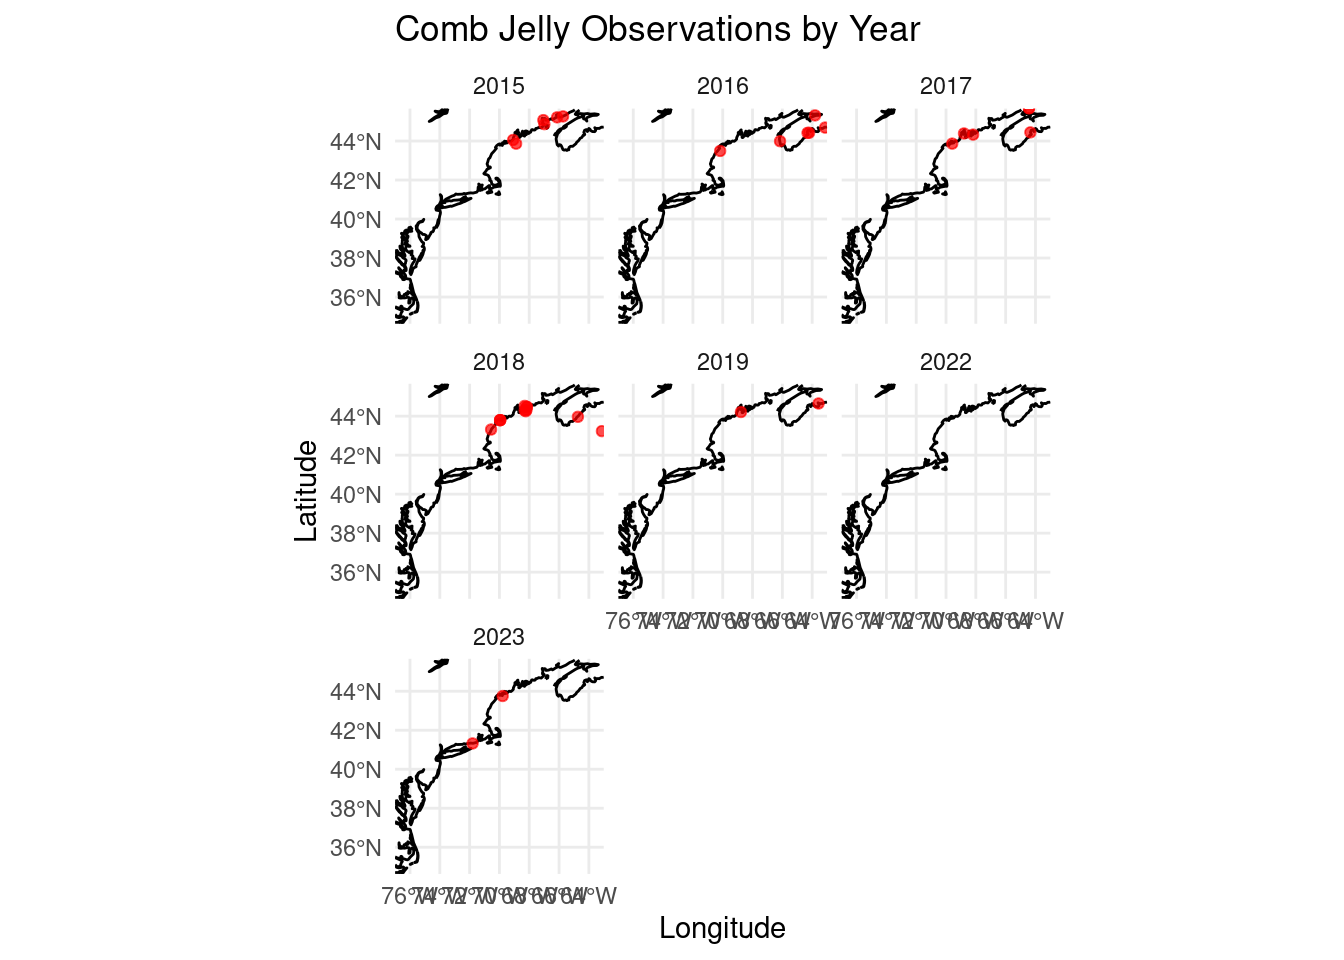
Code
ggplot() +
  geom_sf(data = coast, color = "black") +
  geom_sf(data = obs, color = "red", size = 1.5, alpha = 0.7) +
  coord_sf(
    xlim = c(coast_bbox["xmin"], coast_bbox["xmax"]),
    ylim = c(coast_bbox["ymin"], coast_bbox["ymax"]),
    expand = FALSE
  ) +
  facet_wrap(~ month) +
  labs(title = "Comb Jelly Observations by Month",
       x = "Longitude",
       y = "Latitude") +
theme_minimal() 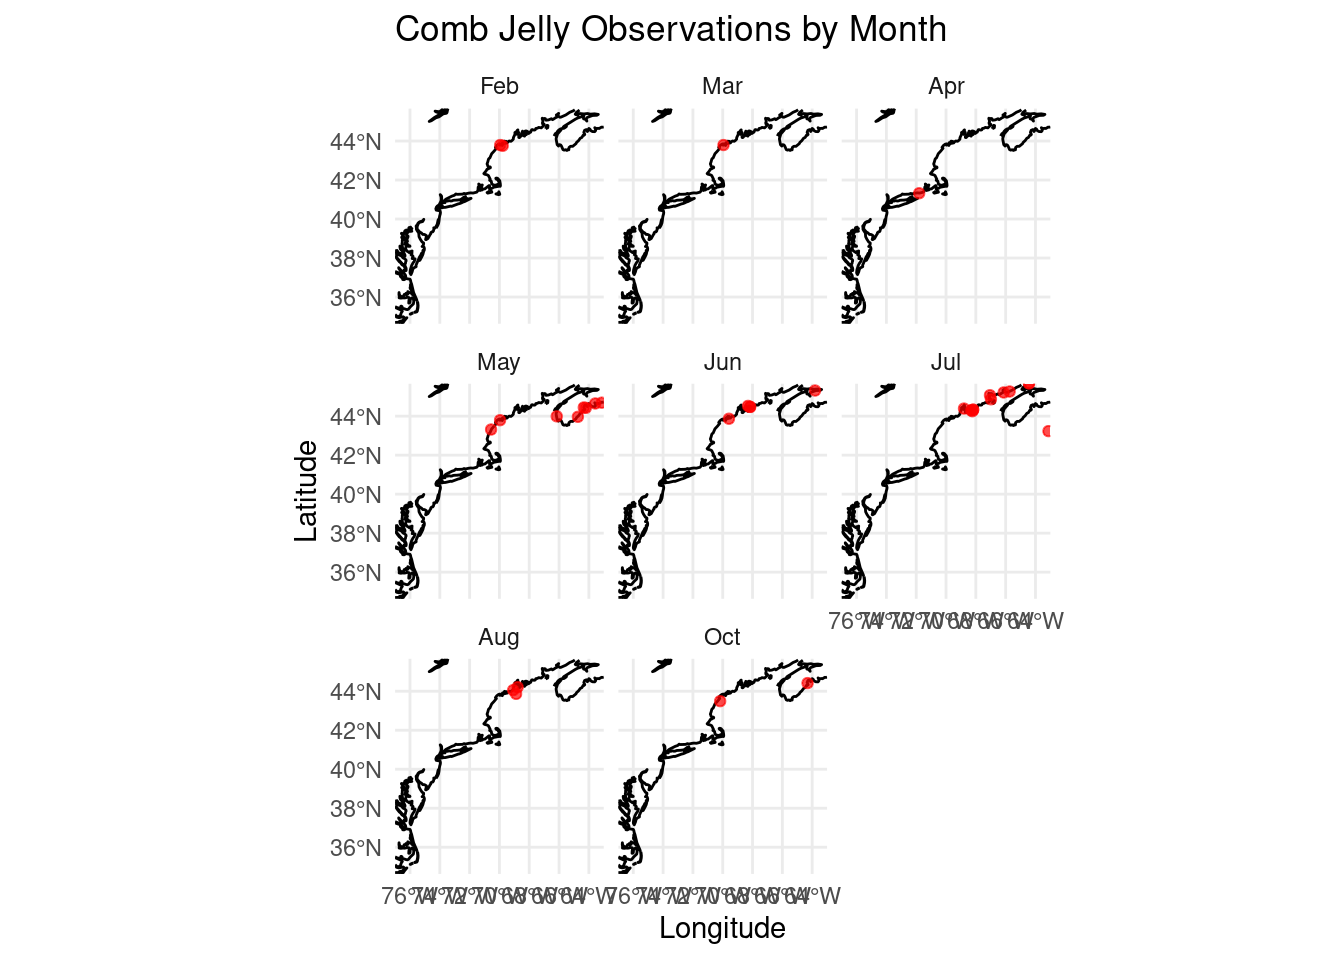
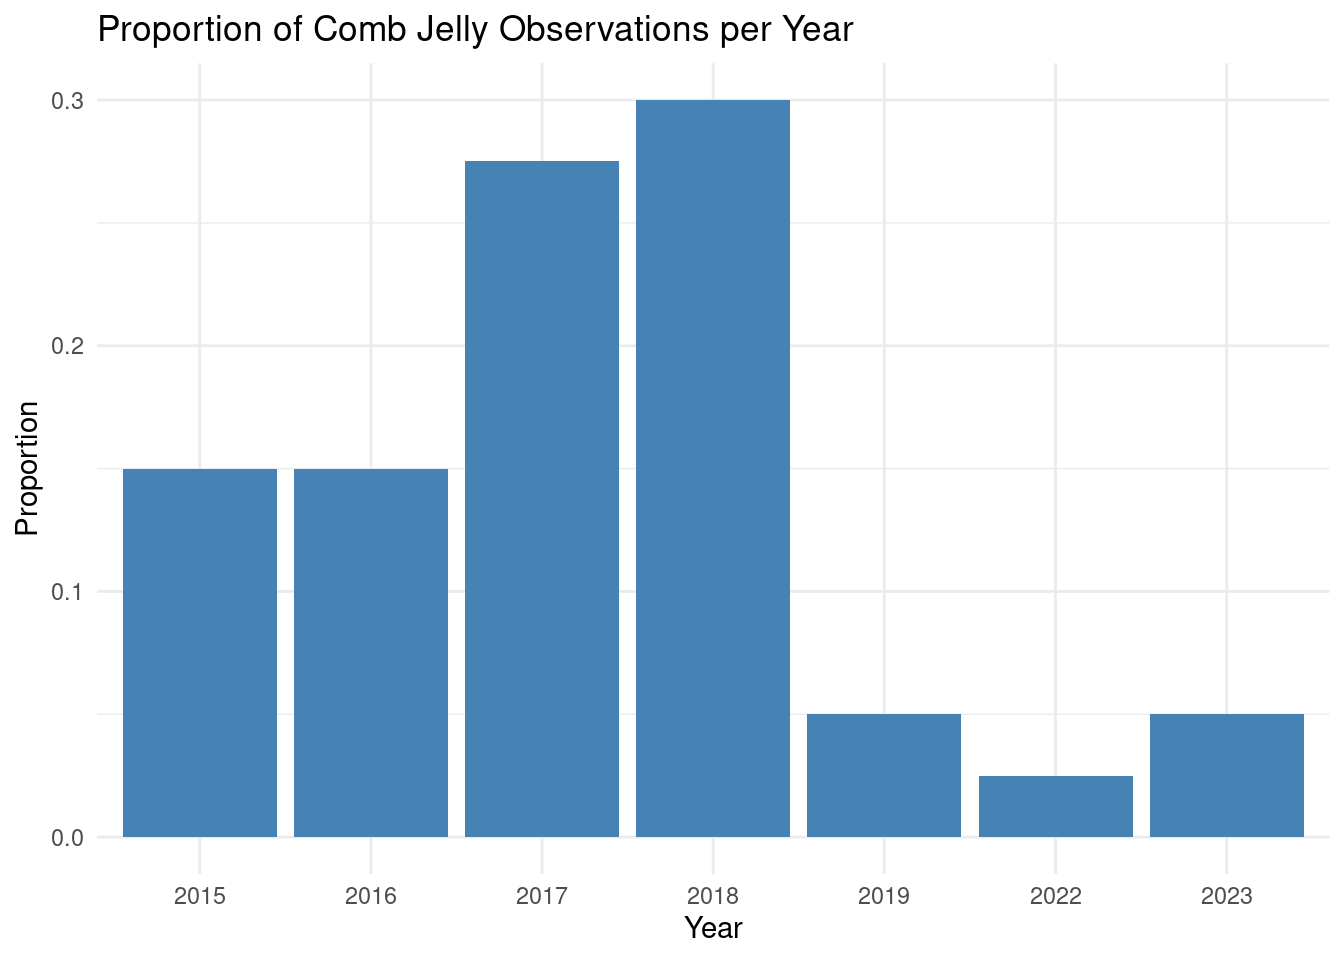
4 Proportion of Observations Histograms
Code
ggplot(obs, aes(x = year)) +
  geom_bar(aes(y = after_stat(prop), group = 1), fill = "steelblue") +
  theme_minimal() +
  labs(
    title = "Proportion of Comb Jelly Observations per Year",
    x = "Year",
    y = "Proportion"
  )
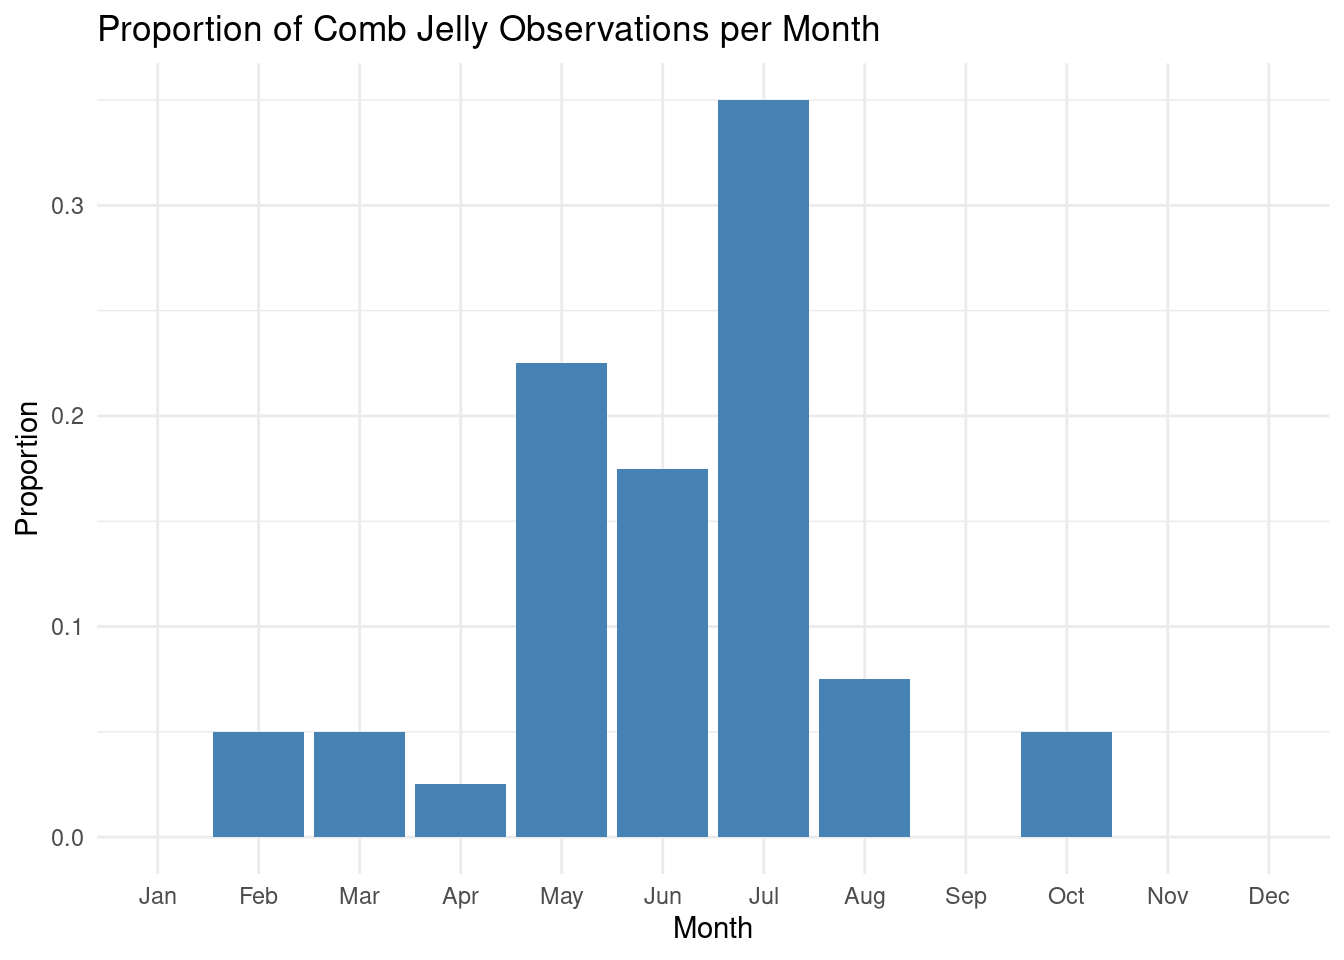
Code
ggplot(obs, aes(x = month)) +
  geom_bar(aes(y = after_stat(prop), group = 1), fill = "steelblue") +
  scale_x_discrete(drop = FALSE) +
  theme_minimal() +
  labs(
    title = "Proportion of Comb Jelly Observations per Month",
    x = "Month",
    y = "Proportion"
  )