here() starts at /mnt/s1/projects/ecocast/projects/jellyscapeJellycast
For the Jellyscape project observations are drawn from a recent release of unstaged ECOMON data. We choose the following groups to belong to the gelatinous “jellyscape” although the list is easily modified.
- Siphonophores (siph)
- Hydromedusea (hydrom)
- Coelenterates (coel)
- Ctenophores (ctenop)
- Salps (salps)
These we can read from the ecomon package and aggregate these species into a count per unit area (10m^2) or count per unit volume (100m^3). Accepting the defaults for the read_ecomon_spp() function yields an aggregated (summed) table for areal abundance for the 5 groups listed.
1 The Ecomon observation data
Here we show the general distribution of records for the 5 groups listed. Later we show more detailed per-group analyses.
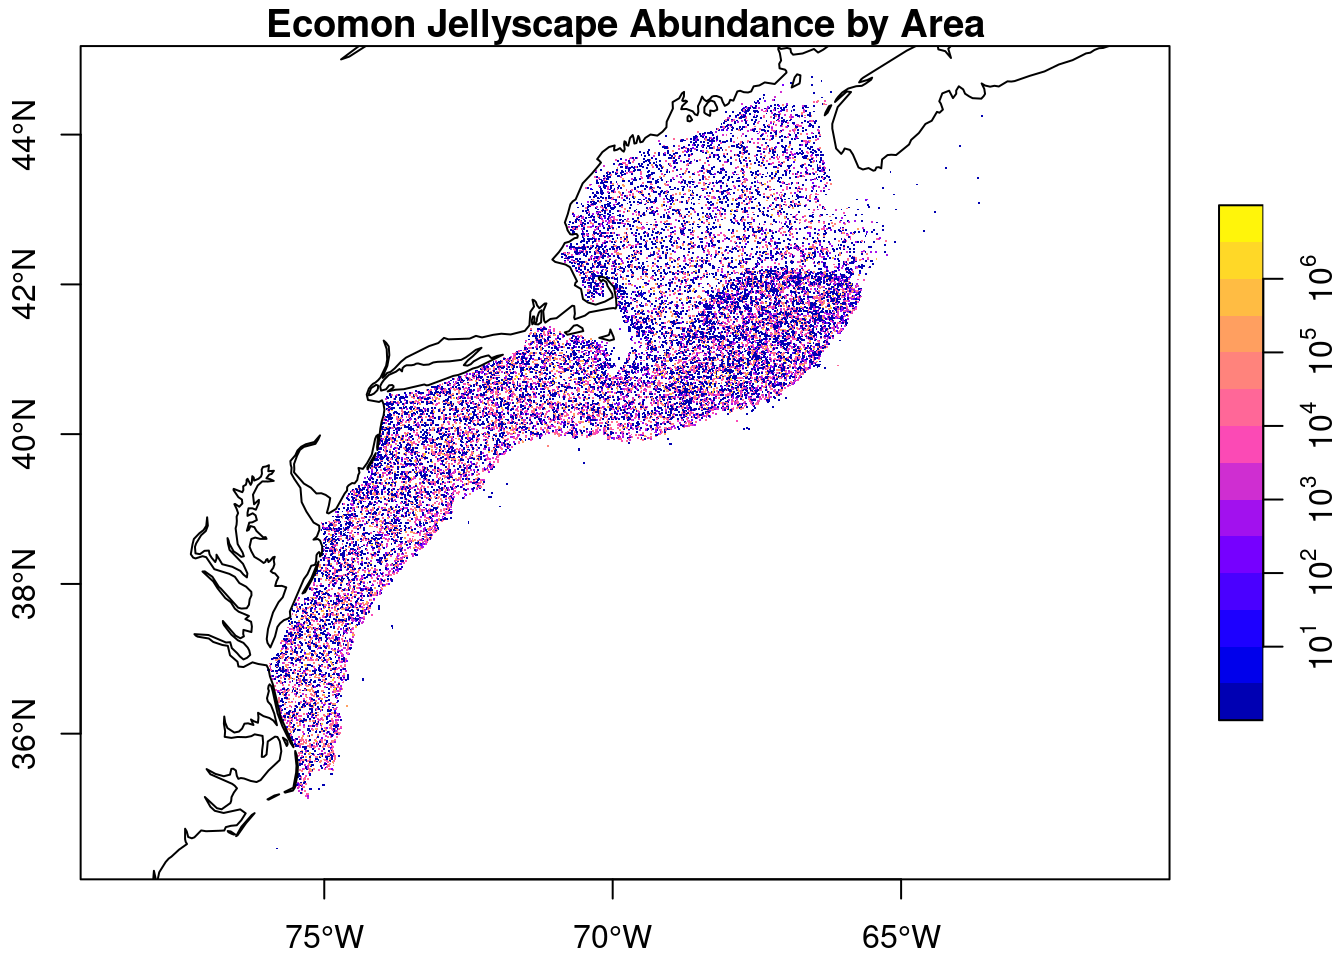
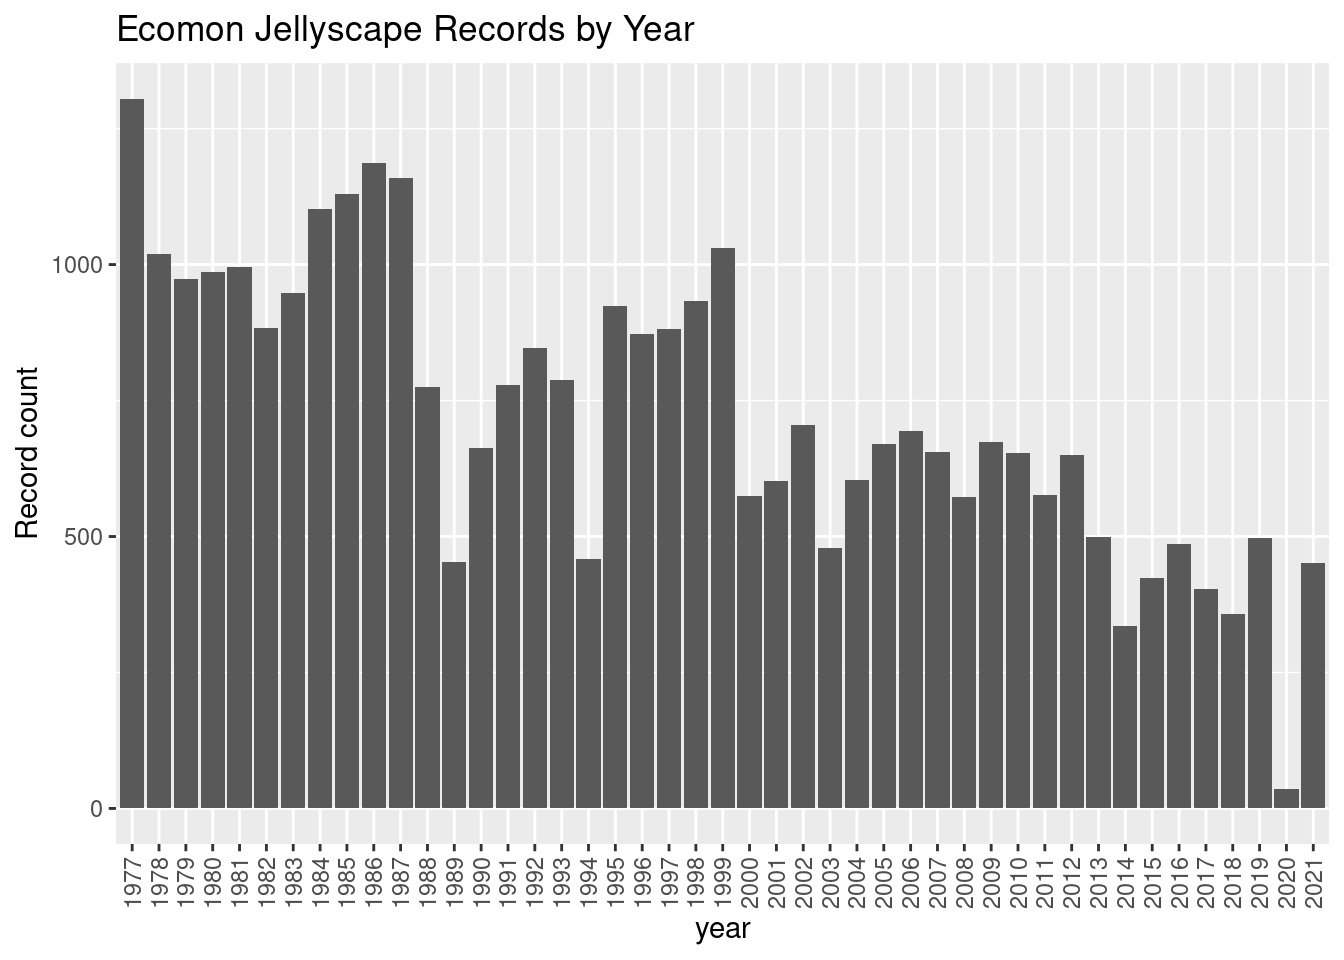
To study just the listed groups, we reduce the data set by discarding all non-listed groups and provide an aggregate abundance as shown above. For the selected groups the data covers 1977-02-13 through 2021-11-15 with 32693 records of observation.
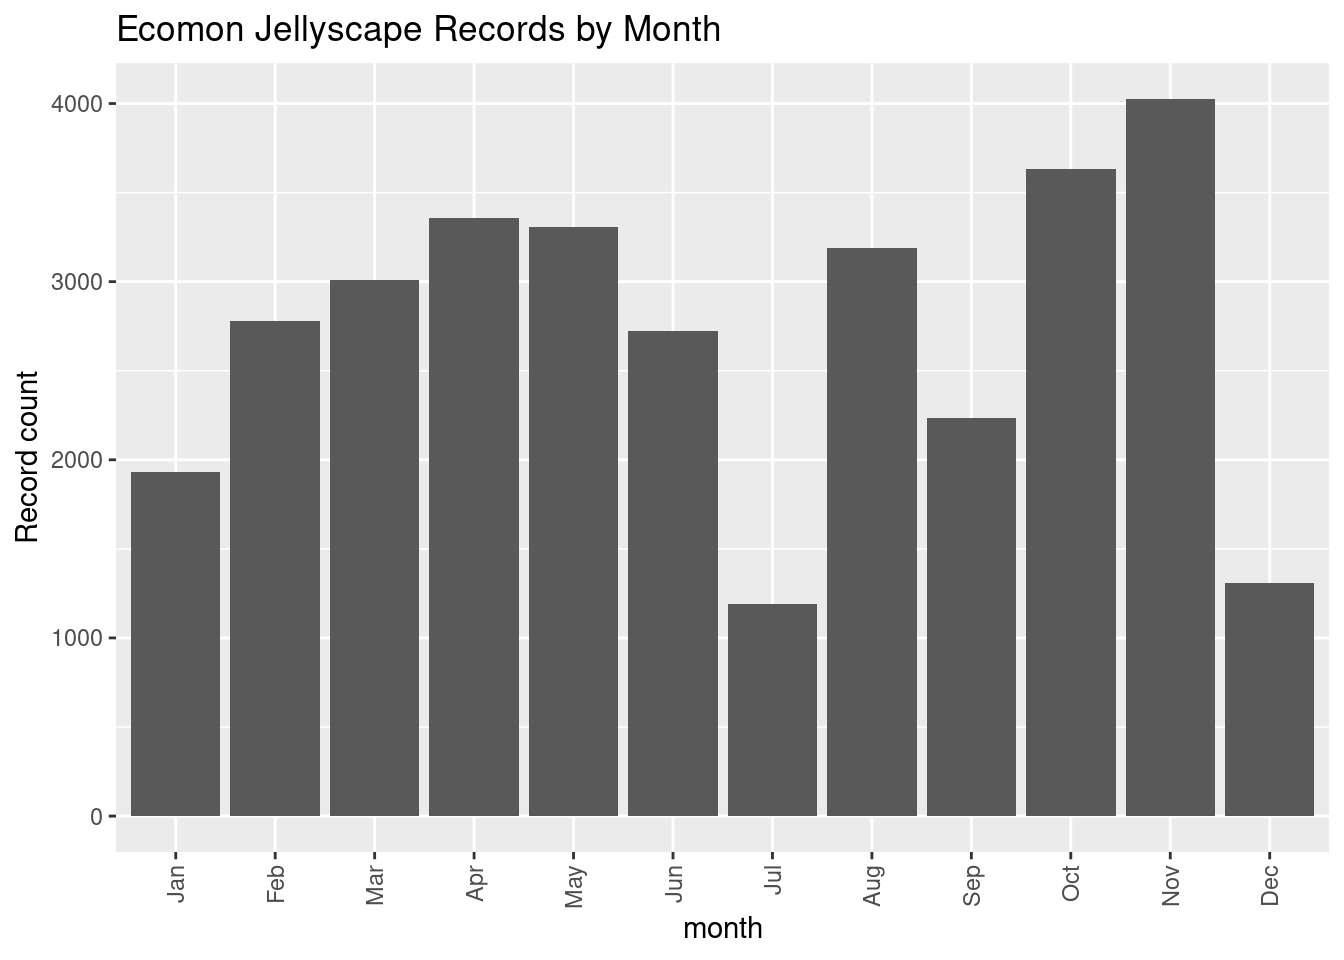
Over the years the number of observations has decreased (that isn’t to say that the effort has decreased.) The survey effort is concentrated in spring and autumn months.