source("setup.R", echo = FALSE)
bb = get_bb(form = 'polygon')
coast = rnaturalearth::ne_coastline(scale = 'large', returnclass = 'sf') |>
  sf::st_geometry()
preds = read_predictors(quick = TRUE)
ensemble = read_ensemble("data/model/tidysdm/v1_ensemble.rds")tidysdm-05-prediction
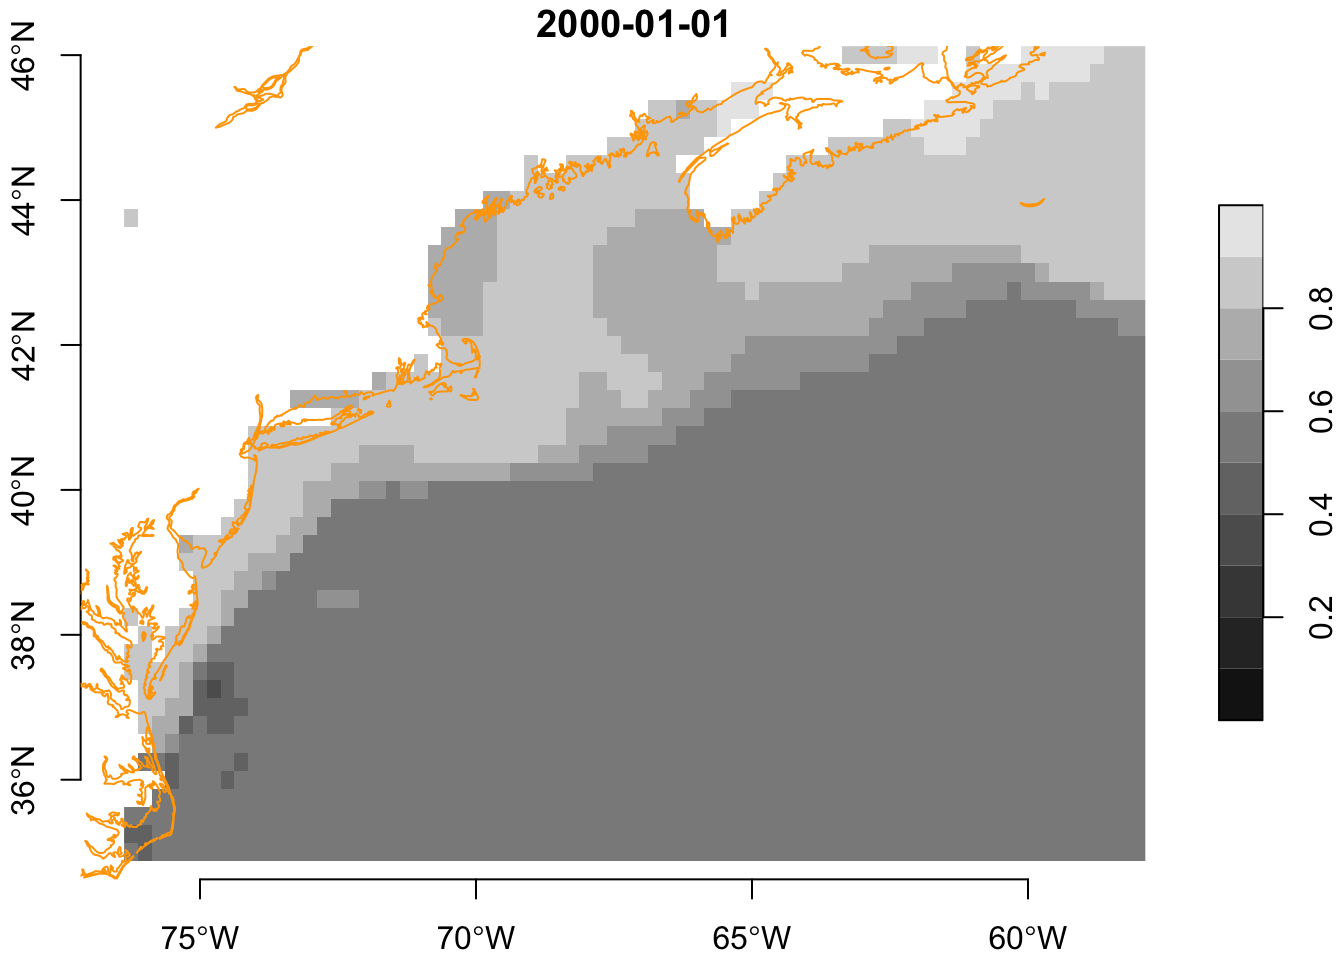
We can predict one “layer” at a time - that is for one date. Here we get the first date.
times = stars::st_get_dimension_values(preds, "time")
p = predict_rasters(ensemble, slice(preds, "time", 1))
plot(p, reset = FALSE, zlim = c(0,1), main = format(times[1], "%Y-%m-%d"),
     breaks = seq(from = 0, to = 1, by = 0.1),
     axes = TRUE)
plot(coast, add = TRUE, col = "orange")
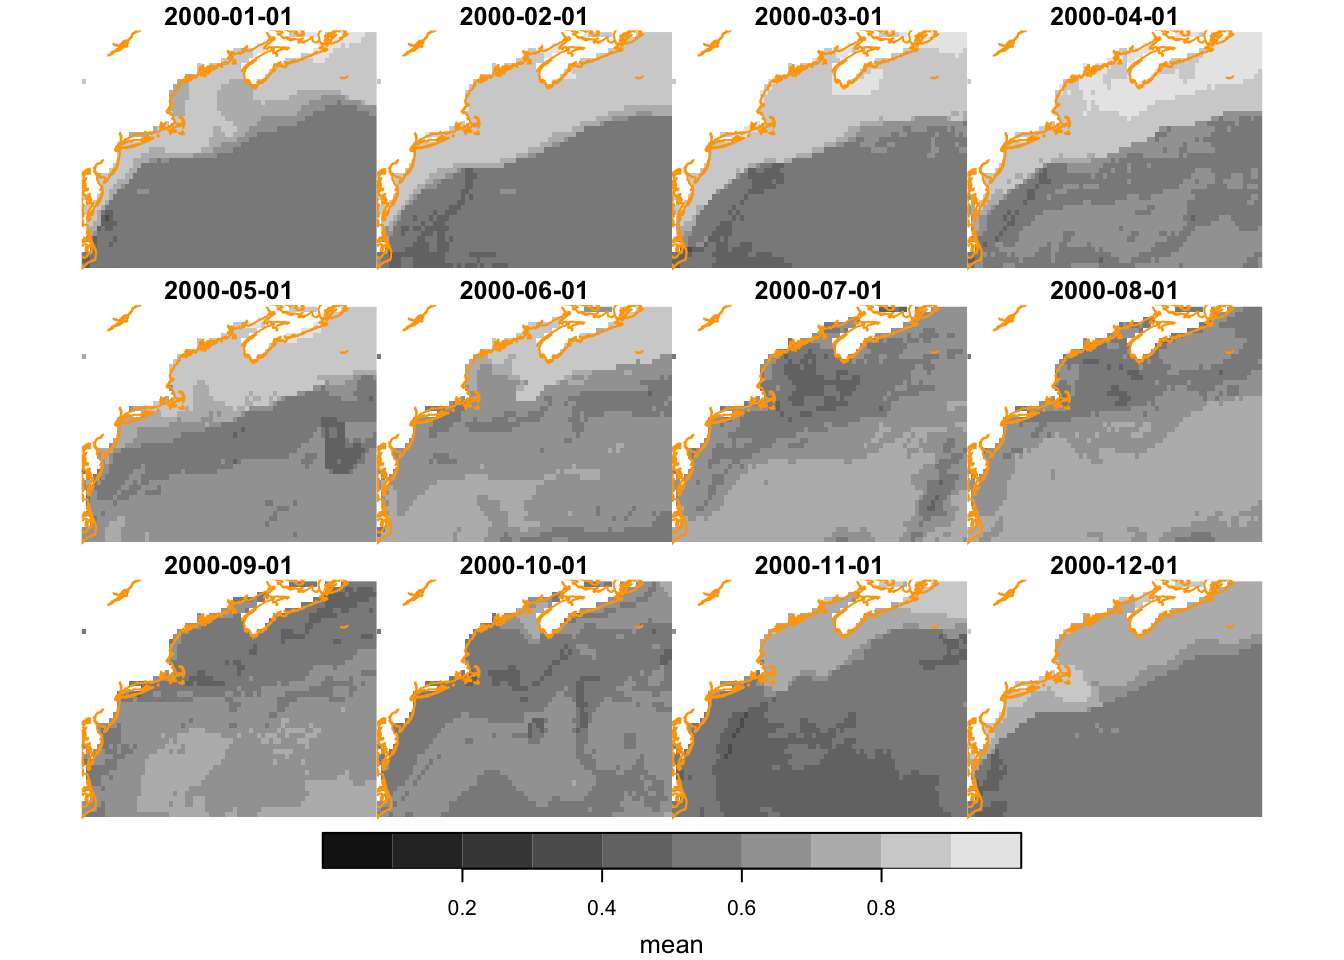
We can try a series of dates. Here’s the first year of our data collection used to make monthly predictions.
p = predict_rasters(ensemble, slice(preds, "time", seq_len(12)))And we can plot a timeseries of rasters. Using a “hook” function allows us to decorate each subplot, in this case by drawing the coastline.
plot_coast = function(...){
  plot(coast, add = TRUE, col = "orange")
}

plot(p,
     breaks = seq(from = 0, to = 1, by = 0.1),
     hook = plot_coast)
So, is that believable? The likelihood of a reported sighting is highest in winter in the Guld of Maine. Ummmm…
Back to top